Are your Facebook ad campaigns achieving your required results? Wondering how to accurately report on Facebook ad performance?
Facebook has become one of the most popular platforms for advertising for online digital advertisers owners.
In addition to the relatively cheap well-targeted ad price and a large number of active users around the world, Facebook dominates the mobile market ahead of other social media giants.
Facebook has advantages in terms of ad targeting, coupled with social engagement potential that appears through features like, comment, & share.
Therefore it is important for you to maximize your Facebook ads ROAS. To help you understand the impact of the Facebook advertising business, there are a number of metrics you should know about, one of which is Facebook ROAS.
In this post, I will explain in detail Facebook’s Return on Ad Spend (ROAS). Before moving deeper, I would like to first define Return on Ad Spend (ROAS).
Return on Ad Spend (ROAS) Definition
As mentioned above, ROAS is short for “Return On Ad Spend”. It is a measurement of how many dollars you will receive for every dollar you spend on advertising.
Return on Ad Spend (ROAS) is a metric that measures the effectiveness of a campaign in digital marketing. By calculating ROAS you can evaluate whether the campaign that you have run is profitable or not.
For example, let’s say you made $20 for every $1 spent on an advertising campaign. That means your ROAS for that campaign is 20:1.
Calculating Facebook Return on Ad Spend (ROAS)
ROAS is calculated after an ad campaign has finished running. The advertiser will be able to understand the effectiveness of the measure of a particular ad campaign by looking at their Facebook Return-On-Ad-Spend (ROAS) figures.
Facebook return on ad spend formula
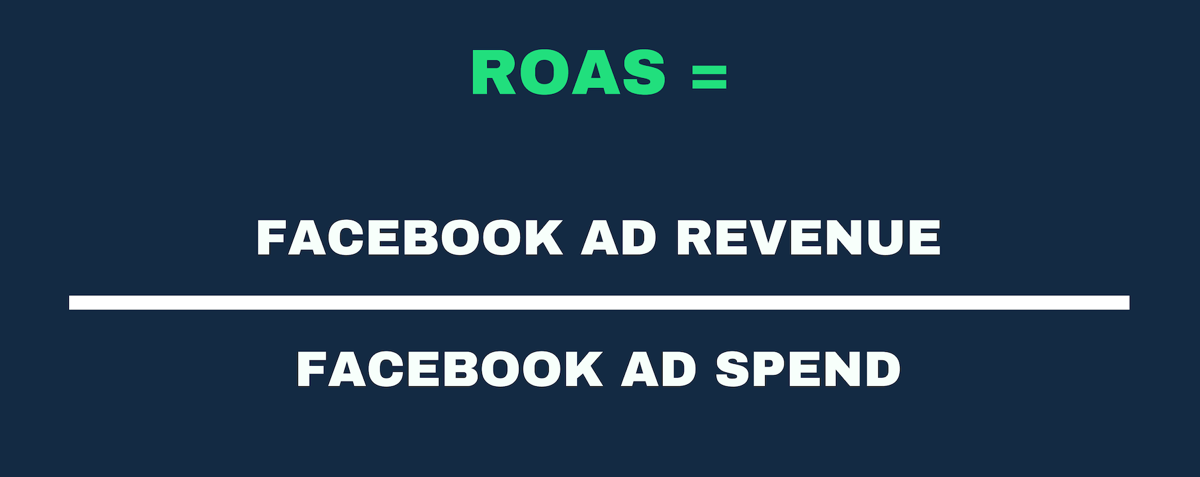
The formula for calculating return on ad spend is simple and it applies to all online advertising ROAS calculations.
You simply need to take your total ad revenue and divide it by the total ad spend to arrive at the ROAS.
In the case of Facebook, you take the total generated Facebook ad revenue and divide it by Facebook ad spend to get your total Facebook return on ad spend.
The businesses that advertise on Facebook can be divided into two main categories :
- Businesses that sell products or services online that customers pay for immediately on their website.
- Service providers that generate leads and convert potential customers off of Facebook via phone or email communication channels.
Whichever category your business falls into, you need to have a clear understanding of your return on ad spend (ROAS) to determine if your campaigns are profitable.
Let’s take a look at the step-by-step guide on setting up your ad account to calculate your Facebook return on ad spend (ROAS).
Now let’s take a look below at how to measure ROAS for both types of businesses :
1. Set Up Facebook Pixel and Conversion Tracking
The first step before calculating ROAS is to set up and install Facebook pixel on your website, as well as any relevant conversion events.
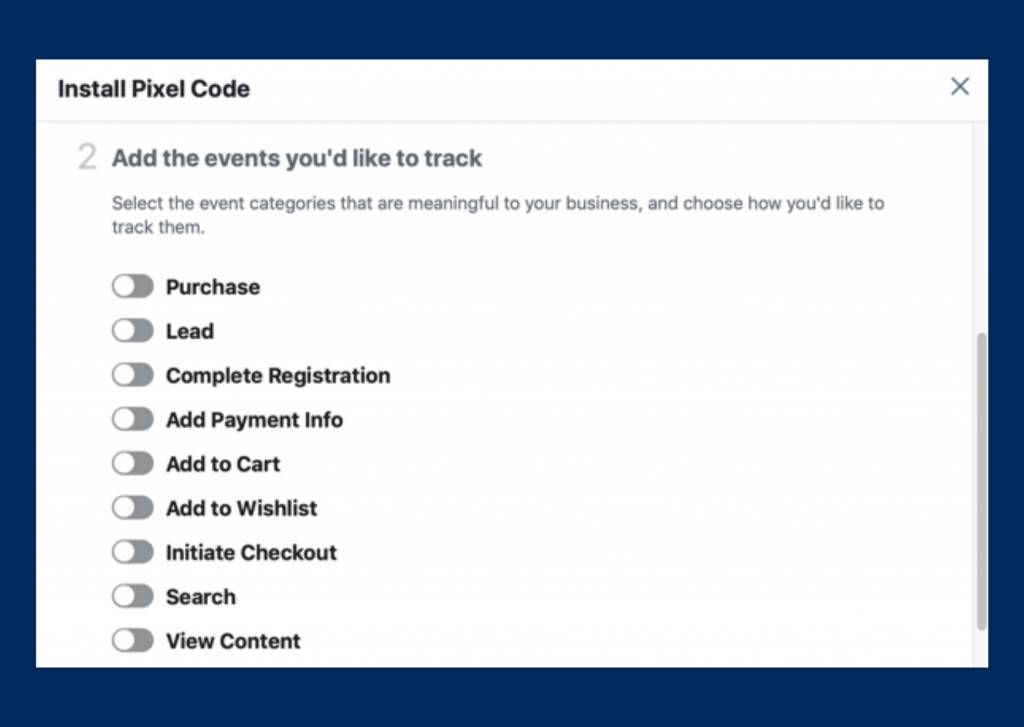
For this step, you need to have the eCommerce event actions set up which include add to cart, initiate checkout and purchase, – If you’re an eCommerce business using Facebook to generate product sales.
However, if you’re a service business generating leads, you want to have the lead event action installed.
If it’s already installed the pixel on your website and your events, check that they’re firing correctly.
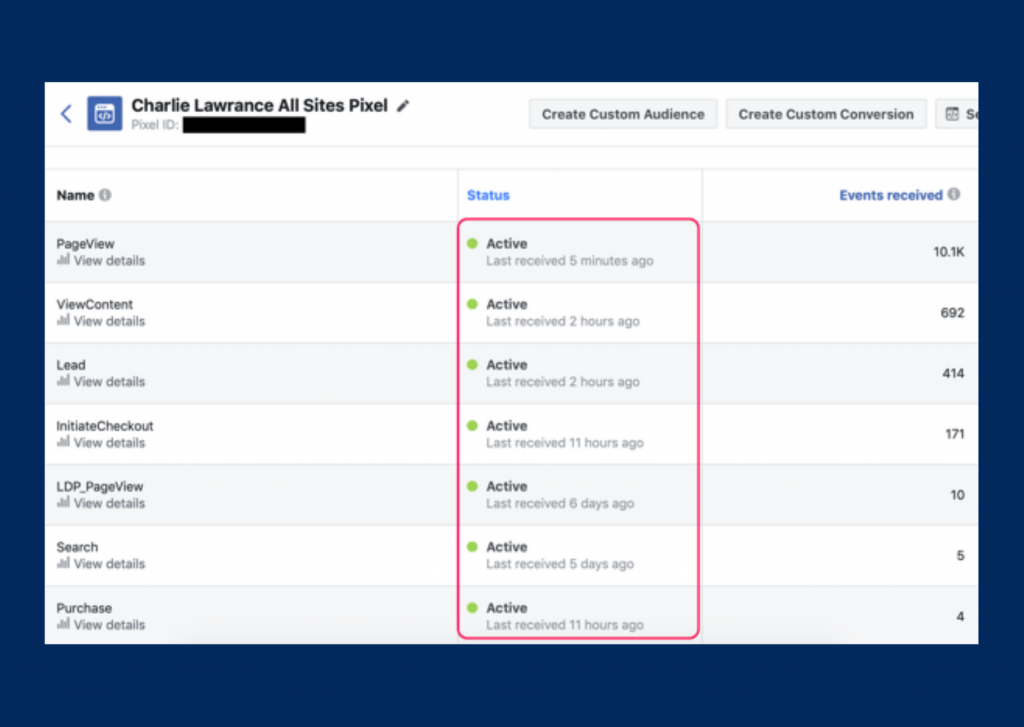
The easiest way to do this is to navigate to your pixel dashboard via the Ads Manager main menu.
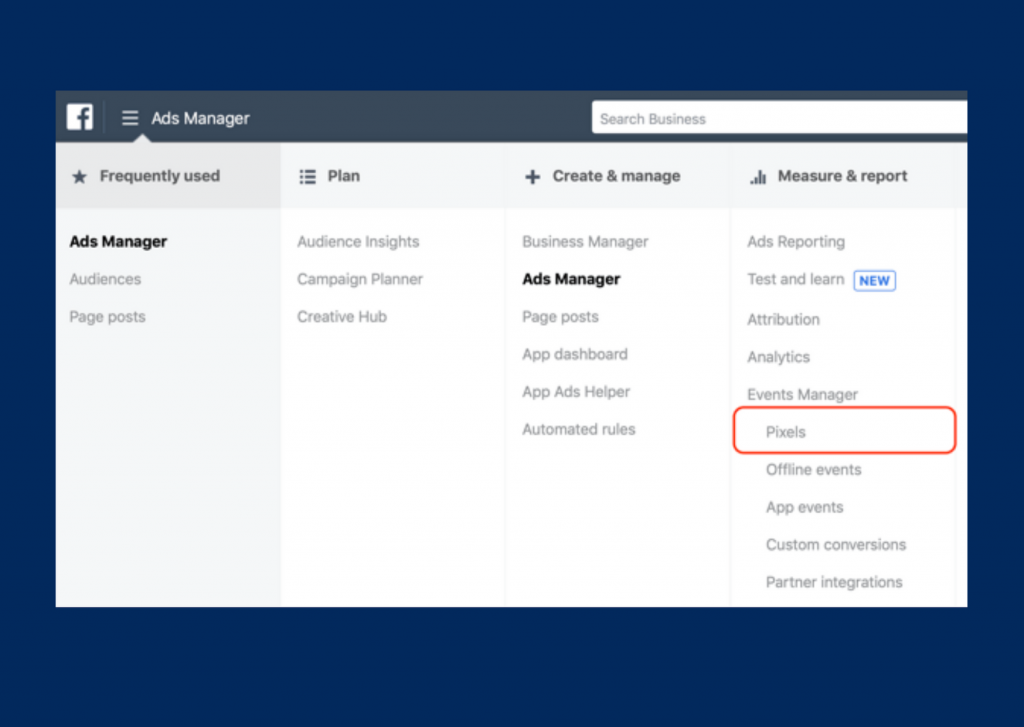
Then, select your pixel and open the full dashboard. In this view, you can see the event actions that are firing. If they’ve been installed correctly, the status column should say Active and when the event was last received.
Click the diagnostics option above the graph view to see any issues with your pixel and event installation, for any events that aren’t firing correctly and show Inactive in the Status column.
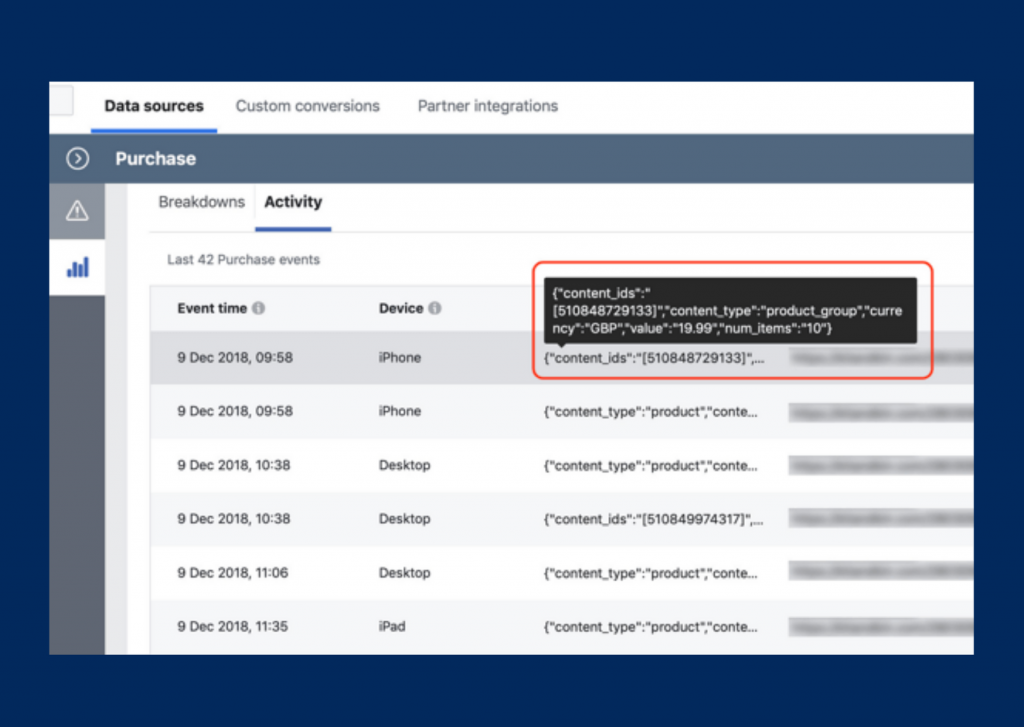
If your business uses the purchase event to track sales: measuring ROAS effectively requires you to track the value of the purchases from Facebook, not just the volume of purchases.
Click View Details under the Purchase event action –> To check that the value of orders is being sent via the pixel to your ad account.
Then in the pop-out window under Parameter, look for the value parameter and number of items parameter, along with content IDs and currency.
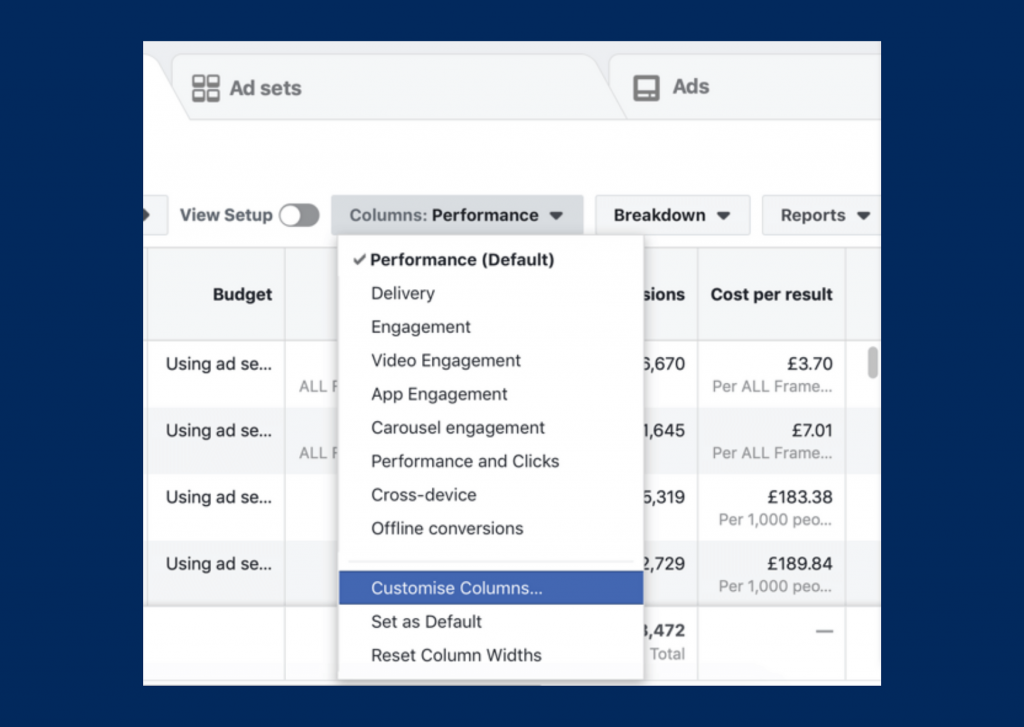
2. Create a Custom Reporting Column in Facebook Ads Manager
Next Step after pixel and event actions are set up is create a custom reporting column that displays key metrics including the number of purchases, the conversion value of those purchases and the return on ad spend.
For this step navigate to Facebook Ads Manager dashboard –> click the Columns: Performance drop-down menu and select Customize Columns.
The reporting creation window then appears. It consists of three columns.
Column 1 –> The metrics categories
Column 2 –> All of the metrics you can report
Column 3 –> the specific metrics in your custom reporting column.
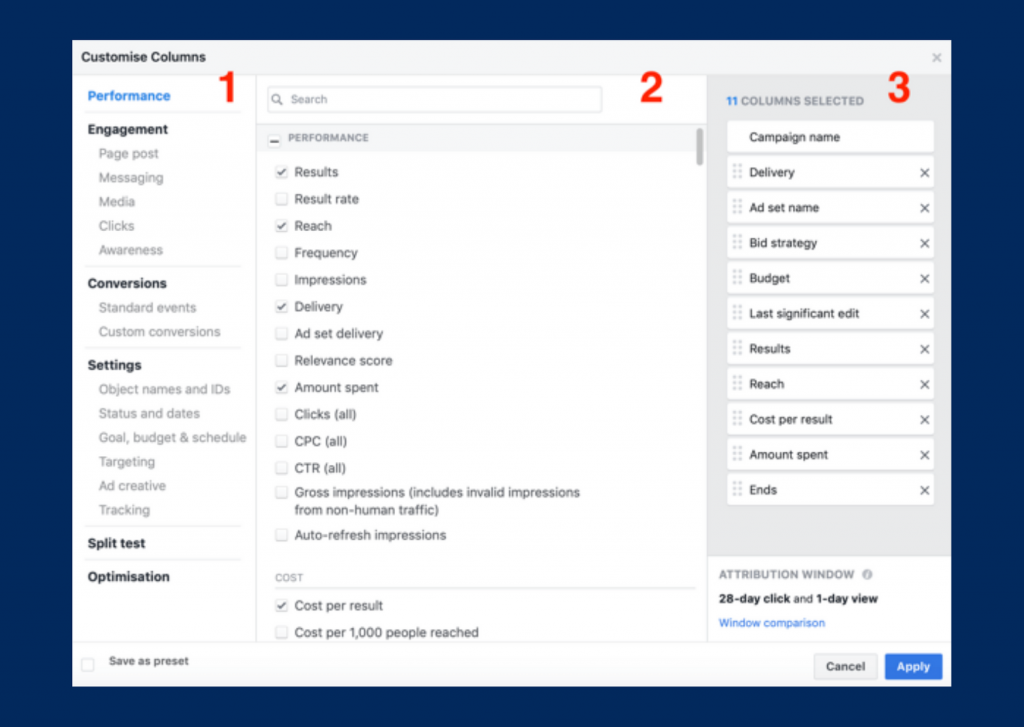
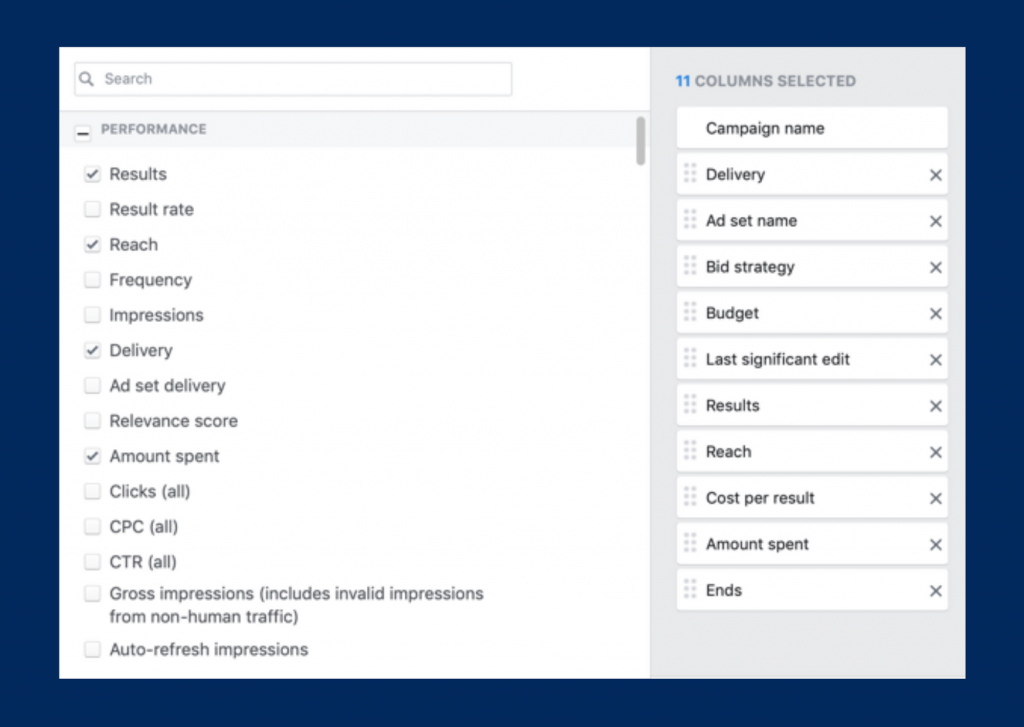
If you want to remove the unwanted metrics that are currently in the reporting column. you can remove all but these 11 core metrics:
- Campaign Name
- Delivery
- Ad Set Name
- Bid Strategy
- Budget
- Last Significant Edit
- Results
- Reach
- Cost per Result
- Amount Spent
- Ends
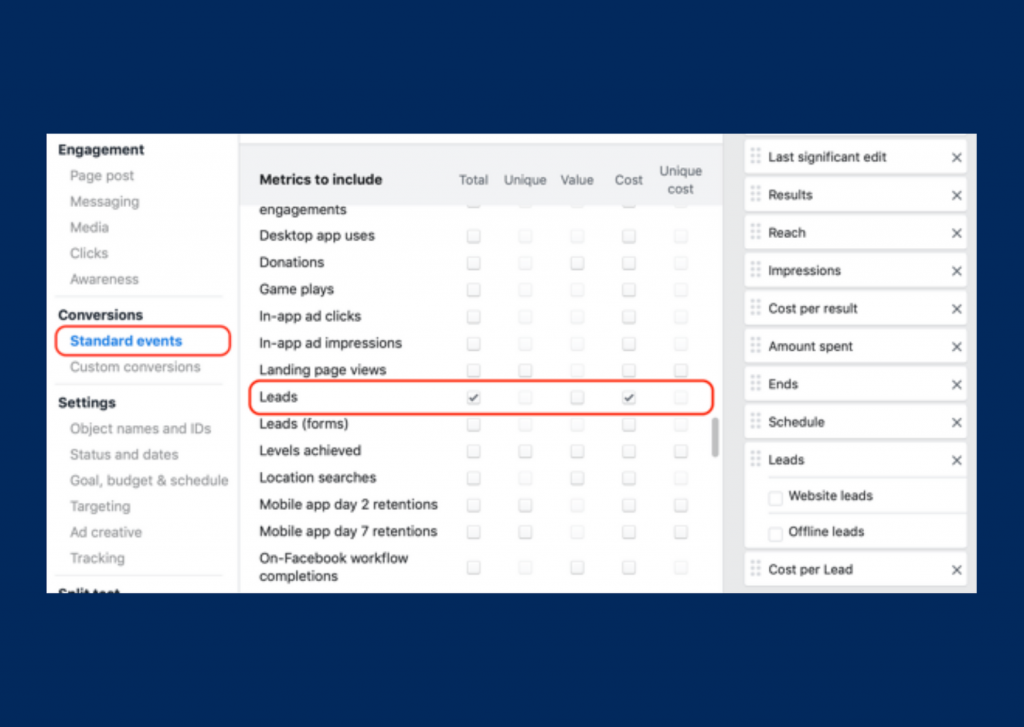
To add in the purchases, conversion value, and ROAS metrics. In the categories section in the left column, select Standard Events under Conversions.
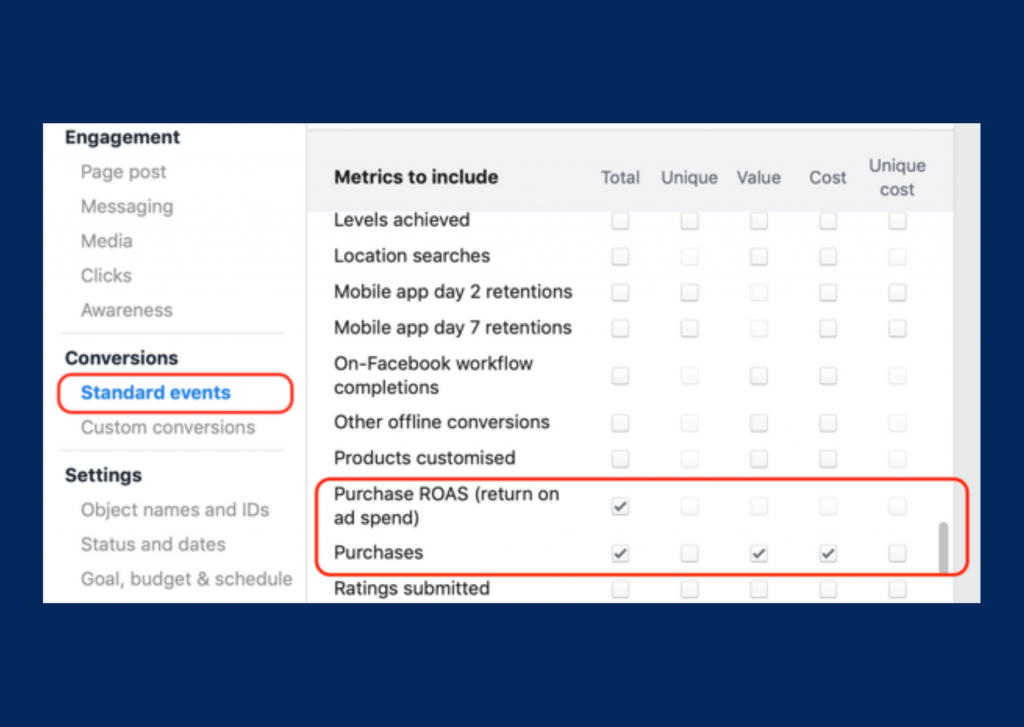
When you select these metrics, Ads Manager adds them to your custom reporting column on the far right. Scroll down to the bottom of that column to edit the segments.
In the total purchase field, you will see a breakdown of these metrics by purchase type such as a mobile app, website, and offline (which are all selected).
If you’re only tracking purchases from your website and not from a mobile app, offline, or through a Facebook store, deselect all of the boxes that are ticked including website purchases.
This may seem counter-intuitive, but you just want the total purchase value, not the segmented data.
Do the same for the conversion of the purchase value metric and the purchase ROAS metric. You should be left with a custom reporting column that includes:
- Campaign Name
- Delivery
- Ad Set Name
- Bid Strategy
- Budget
- Last Significant Edit
- Results
- Reach
- Cost per Result
- Amount Spent
- Ends
- Website Purchases (no segmenting)
- Cost per Purchase
- Purchases Conversion Value (no segmenting)
- Website Purchase ROAS (no segmenting)
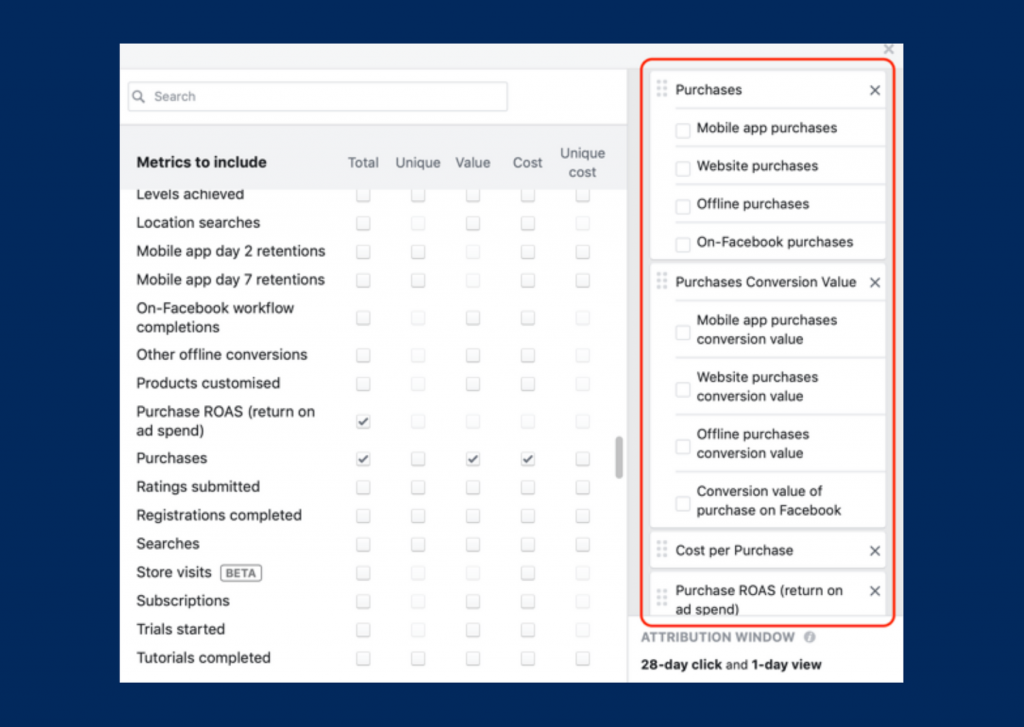
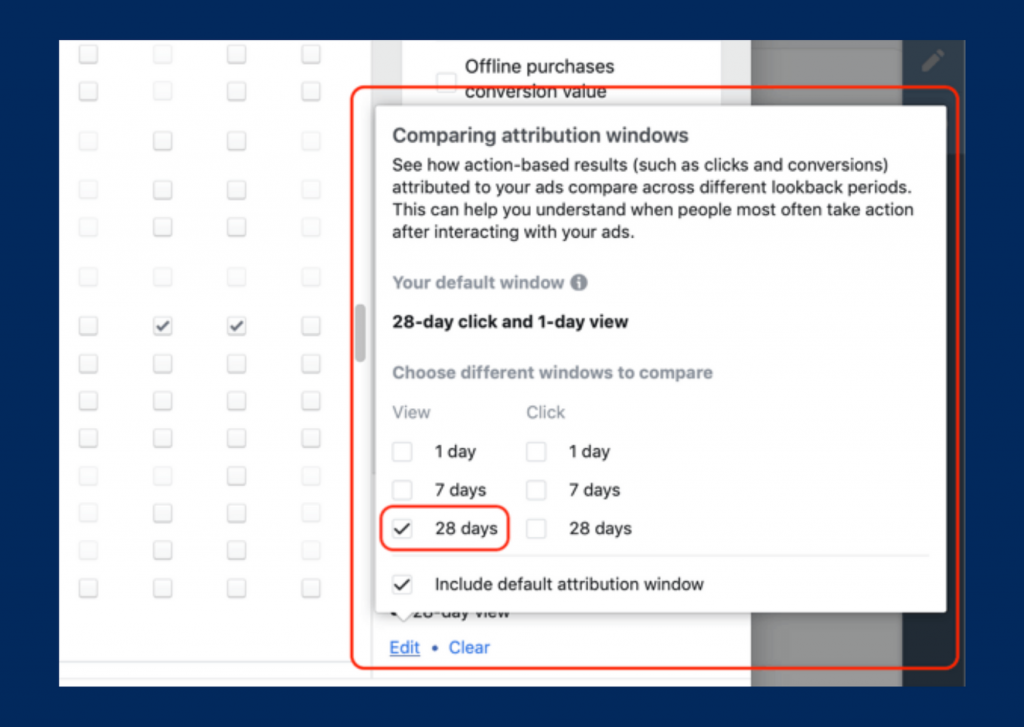
If you want to set your reporting window. The attribution window of 28-day click and the 1-day view is selected by default. However, to get a true picture of how your campaigns and ads are performing, you want to add the 28-day view window as well.
Select Window Comparison –>Then select the checkbox next to 28 Days under the View column.
Click Save as Preset in the lower-left corner, give your custom reporting column a name (such as “ROAS”), and click Apply.
3. Determining Your Facebook ROAS for Purchases
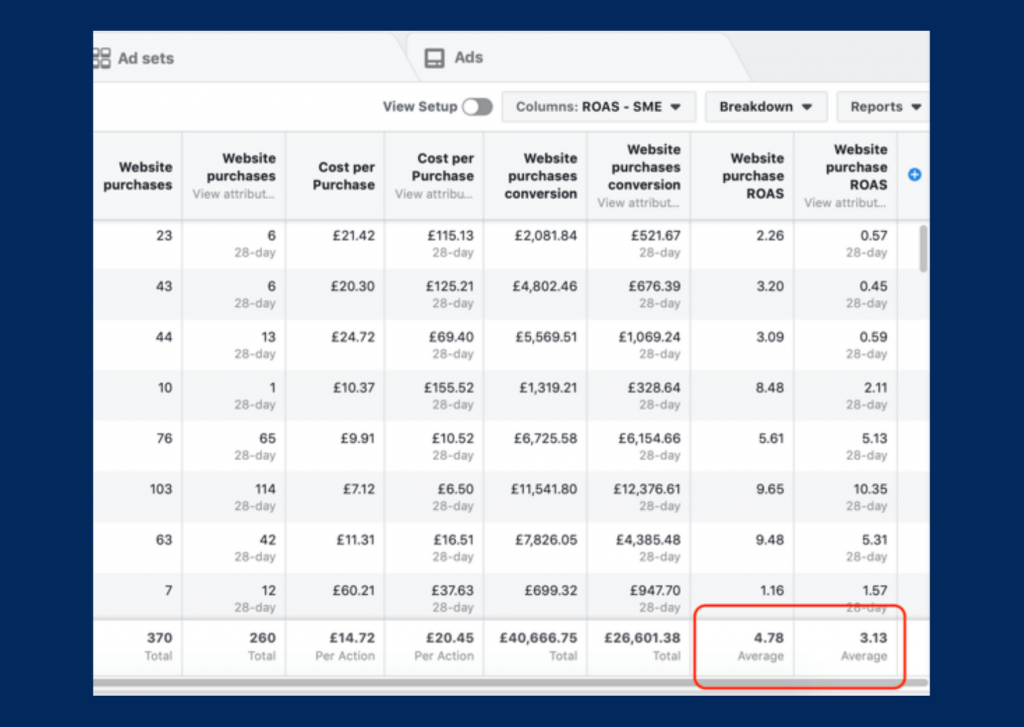
To analyze the Purchase and ROAS metrics in your new reporting column. You will see two columns for each metric. The first column shows the results for the default attribution window: 28-day click and 1-day view. The second shows the 28-day view results.
To analyze this, set your date range via the date picker in the top-right corner.
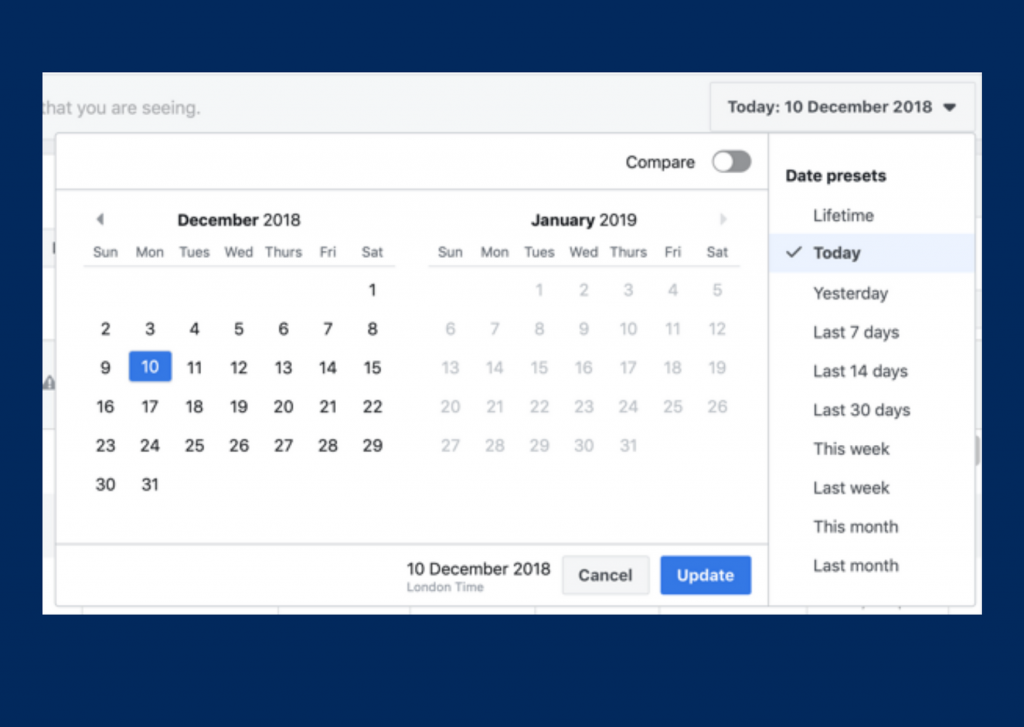
If you’re just starting out, select Lifetime. But if you’re already spending five or six figures per month on Facebook, choose Last Month to do a monthly ROAS analysis.
Then, look at your totals row and add together your two ROAS figures to get your total ROAS across both data views.
Your ROAS will be expressed as a decimal such as 3.7. That means that across all of your campaigns in your given time period you generated a 3.7X return on your ad spends.
4. Measuring Facebook ROAS for Lead Generation
If your business falls into the second bucket mentioned earlier and you’re using Facebook to generate leads, measuring your ROAS isn’t as easy.
It starts the same way as the method above. First, you need the pixel installed on your website, as well as standard events set up.
Instead of purchase and eCommerce events, you want to set up the lead conversion event for contact points on your website such as your contact form confirmation and any lead magnets you’re using to get people on your email list.
Using the same method of building a custom reporting column detailed in step 2 above, create a reporting column with the lead event action and any costume conversions you created for steps along your lead funnel.
Conclusion
ROAS, or return on ad spend, is one of the most important metrics for online advertisers.
Essentially, ROAS answers the fundamental marketing question, “If I put [X amount of money] into this marketing channel, what will I get back out?”
Return on Ad Spend (ROAS) is a metric for evaluating the effectiveness of an ongoing campaign. To be able to calculate ROAS on Facebook Ads you must install conversion tracking.
When you find a campaign with a high ROAS value you might need to allocate a bigger budget for that campaign.