Updated 21/05/2025
The Facebook Ad benchmarks come with a great sign of relief with the current trend of digital ads across industries, you don’t need to panic about how to get your paid ads more engaging again. I am sure you will not be shocked to know that Facebook is one of the fastest-growing ad networks.
According to Statista, Facebook’s figure in the last 12 months has a daily active user put at 1.98 billion. While the number of Facebook users has significantly increased, the number of Facebook advertisers has crossed the point of 10 million.
Though, over 10 million advertisers who have chosen this platform in the last 2 years are faced with some pockets of challenges. However, the best Facebook ad benchmarks for your industry in 2022 we have put together here in this article could serve as guidance in order to undo the barrier of banner blindness and ad fatigue, which are the most challenging.
As a matter of fact, many advertisers and even your users face the same. Be prepared to overcome this huddle by the time you read through this article.
This article titled the best Facebook Ad benchmarks for your industry in 2022 is designed to cover some tools that will help you. Find here the best pick of the four prominent Facebook ad performance benchmarks, when properly applied will help work for your industry.
What are the main metrics for Facebook ads?
Benchmarks are the essential and most valuable tools that offer you an insight into present best practices and at the same time guide you on how best to find opportunities that will help improve your ad campaigns. Yes, this is critical because it helps advertisers manage their finances.
The significance of the metrics, though, may differ from industry to industry. I am sure you will find this helpful since there will be plenty of crossovers and probably if you don’t find one that is suitable for your business on the list, note that there is some overlapping in the different spheres.
Find here the averages across these Facebook metrics for eighteen industries: Education, Employment & Job Training, Apparel, Auto, B2B, Beauty, Consumer Services, Finance & Insurance, Healthcare, Fitness, Home Improvement, Industrial Services, Legal, Real Estate, Retail, Technology, and Travel & Hospitality. With this intro, I believe we are good to go now!
The Facebook ad performance benchmarks include:
- Click-Through Rate (CTR) on Facebook by industry
- Cost per Click (CPC) on Facebook by industry
- Conversion Rate (CVR) on Facebook by industry
- Cost per Action (CPA) on Facebook by industry
Find each metric by industry: CPC, CTR, Conversion rate, CPA
#1.1. The click-through rate on Facebook (CTR)
What are the Facebook CTR benchmarks? This has to do with the percentage of users who click on your ad. However, to know your average click-through rate, the formula to calculate is:
Take the number of ad clicks and divide it by the number of ad impressions. You can multiply by one hundred (100). This is how you can arrive at the click-through rate.
In simple terms:
(Number of ad clicks ÷ number of ad impressions x 100 = click-through rate)
The average CTR across all industries is 0.9%.

It is true that getting a good legal or retail professional may not be easy, though it will be hard to impress clients looking for a lawyer. Consequently, these industries won the click-through rate race with an average percentage of 1.61% and 1.59%, respectively. While Apparel (1.24%), beauty (1.16%), and technology (1.04%) are other spheres scoring high above others.
Looking at the available data here, the industry with the lowest results according to its click-through is employment & job training (0.47%).
It is important to state here that people use Facebook mainly for entertainment. With this, it becomes extremely difficult to distract such people from their needs and suddenly make them look for a job.
| Legal | 1.61% |
| Apparel | 1.24% |
| Retail | 1.59% |
| Technology | 1.04% |
| Beauty | 1.16% |
| Employment & Job training | 0.47% |
| Fitness | 1.01% |
| Real estate | 0.99% |
| Travel & Hospitality | 0.90% |
| Healthcare | 0.83% |
| Auto | 0.80% |
| B2B | 0.78% |
| Education | 0.73% |
| Industrial services | 0.71% |
| Home Improvement | 0.70% |
| Customer service | 0.62% |
| Finance & Insurance | 0.56% |
1.2. Cost-per-click rate (CPC)
Cost-per-click (CPC) is the metric that reveals the sum of money that you are required to get from every important click you made. This can be estimated using the formula:
Take your total ad spend and divide it into the number of ad clicks, then you can arrive at a cost per click.
(Total ad spend ÷ number of ad clicks = cost-per-click)
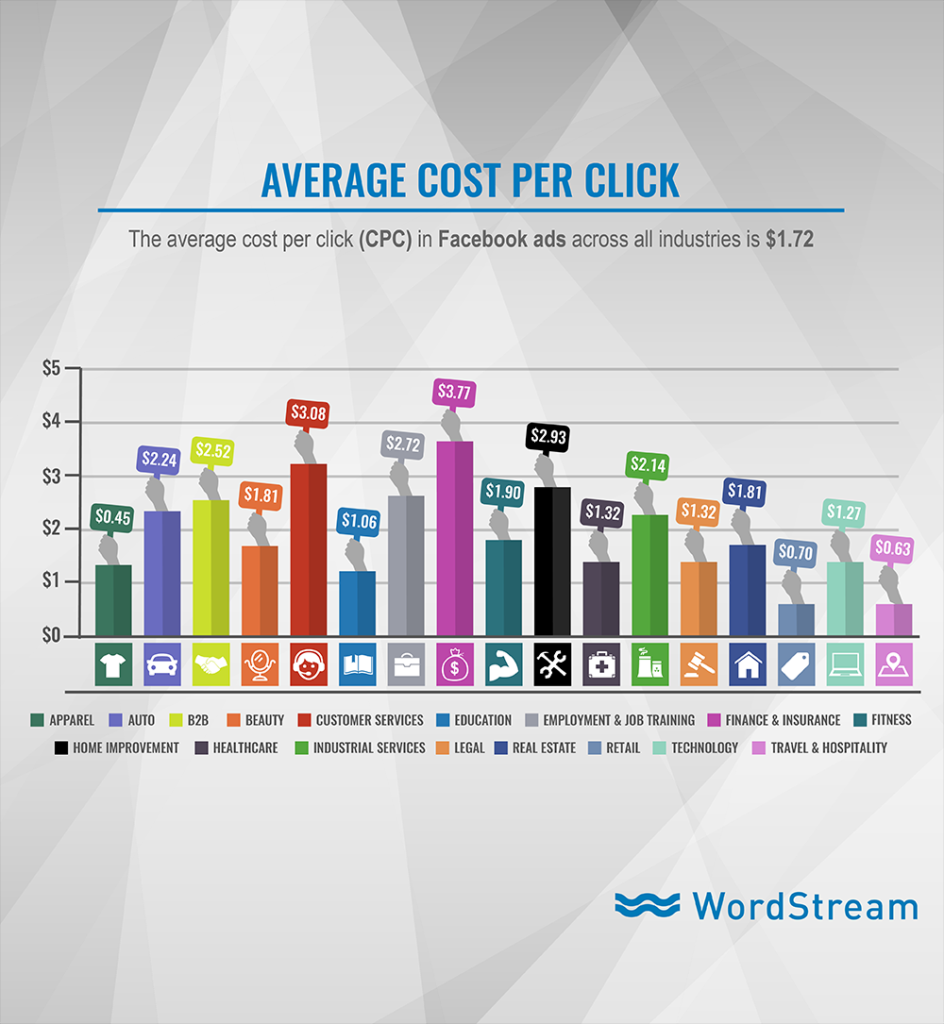
Looking at the data available, the average CPC Facebook offers across all spheres is $0.72.
Going by the data we have here, the industry that leads the race is finance and insurance. However, the cost of $3.77 per click is a testament to the cost of the product the industry actually promotes.
While the industry with the lowest clicks is apparel ($0.45), travel & hospitality ($0.63), and retail ($0.70) spheres. Despite the good cost-per-click results, Facebook doesn’t guarantee easy marketing for these spheres.
This is because they have enjoyed a sizeable audience even with low CPCs. It is based on this that the owners need to understand how to manage their budgets to make them work efficiently.
| Finance & Insurance | $3.77 |
| Customer services | $3.08 |
| Home Improvement | $2.93 |
| Employment & Job training | $2.72 |
| B2B | $2.52 |
| Auto | $2.24 |
| Industrial services | $2.14 |
| Fitness | $1.90 |
| Beauty | $1.81 |
| Real estate | $1.81 |
| Healthcare | $1.32 |
| Legal | $1.32 |
| Technology | $1.27 |
| Education | $1.06 |
| Retail | $0.70 |
| Travel & Hospitality | $0.63 |
| Apparel | $0.45 |
1.3. Conversion rate (CVR)
Many have a feeling that a click can yield a positive result. However, not in all situations a click serves the desired purpose. However, what you basically need is a user to convert. It’s always useful to know your conversion because it’s one of the accurate Facebook industry benchmarks to see the percentage of the overall clicks that generated a result.
Find the formula required to calculate CR:
Number of ad conversions ÷ number of ads clicks x 100 = conversion rate
The average CR across all industries is 9.21%.
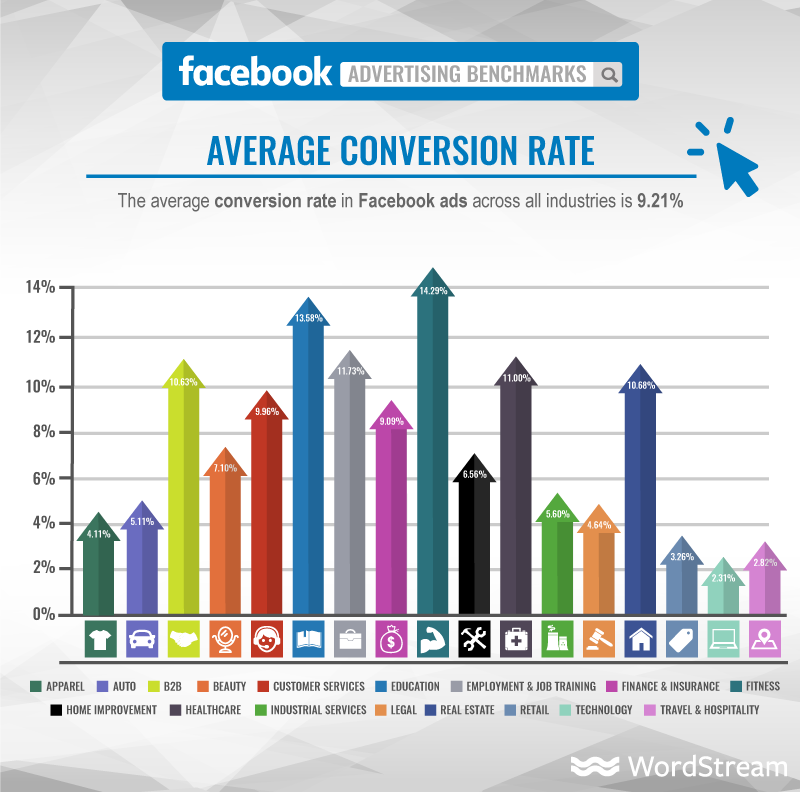
Data available reveal that even as hard as taking up fitness and sports is, it doesn’t necessarily concern the Facebook conversion for the industry. Look at its convert scale of 14.29%. While other leaders on the board are in education (13.58), B2B (10.63), healthcare (11.00), and real estate (10.68).
Other spheres like technology (2.31), travel & hospitality (2.82), and retail (3.26) don’t benefit that much and have lower conversion rates. For these spheres, remarketing is particularly valuable, as it helps drag the people in and make them convert.
| Fitness | 14.29% |
| Education | 13.58% |
| Employment & Job training | 11.73% |
| Healthcare | 11.00% |
| Real estate | 10.68% |
| B2B | 10.63% |
| Customer services | 9.96% |
| Finance & Insurance | 9.09% |
| Beauty | 7.10% |
| Home Improvement | 6.56% |
| Industrial services | 5.60% |
| Auto | 5.11% |
| Legal | 4.64% |
| Apparel | 4.11% |
| Retail | 3.26% |
| Travel & Hospitality | 2.82% |
| Technology | 2.31% |
1.4 Cost-per-action rate (CPA)
Cost-per-action (CPA) is the price an advertiser pays for users’ target action after engaging with the ad. It is indeed a great tool since it helps you to know how much you spent on a specific action.

With the data available, the average CPA across all industries is put at $18.68.
The most successful industry on Facebook, measured by CPA, is Education ($7.85). And really, the topic connects well with the relatively young Facebook audience.
On the contrary, buying an auto, mending your home, or finding a skilled IT specialist may be quite expensive on Facebook. The payment possibility and the lifetime value in such industries are indeed higher, meaning that they finally pay back in the end.
| Technology | $55.21 |
| Home Improvement | $44.66 |
| Auto | $43.84 |
| Finance & Insurance | $41.43 |
| Industrial services | $38.21 |
| Customer services | $31.11 |
| Legal | $28.70 |
| Beauty | $25.49 |
| B2B | $23.77 |
| Employment & Job training | $23.24 |
| Travel & Hospitality | $22.50 |
| Retail | $21.47 |
| Real estate | $16.92 |
| Fitness | $13.29 |
| Healthcare | $12.31 |
| Apparel | $10.98 |
| Education | $7.85 |
Build your own Facebook advertising benchmarks
Building your own Facebook ad benchmarks is simply the best. This is because the campaign that worked weeks back may not necessarily work today. Also, the campaign that has been perfectly working for three years may suddenly stop working in the next couple of weeks.
This is why as long as you are in the market with a lot of demands, you will constantly be refining and redefining using the best practice approach in testing new ideas.
Remember, your data is only as good as what you do with it. Therefore, this serves as an eye opener and when you implement it rightly, it will help grow your business.
Conclusion
It is indeed quite a good decision to take in analyzing the four benchmarks and looking at their significance.
This is because it gives you a good idea about your performance based on the industry. Though the process could be complex, when you use them for ad automation and keep all the metrics in one place, sure it will make your marketing much easier.
Although the benchmarks provide crucial data, always remember that the most accurate metrics come from your past performance. So, if you find yourself at a lower ebb with these numbers, note that you need a significant improvement.